Creating Artifacts
Ask Chat to create specific types of output:Artifact Types
Charts and Graphs
Charts and Graphs
Chat can generate:
- Line charts (time series, trends)
- Bar charts (comparisons, rankings)
- Pie charts (composition, market share)
- Scatter plots (correlations, distributions)
- Area charts (cumulative trends)
Tables
Tables
Formatted tables with:
- Sortable columns
- Summary rows
- Highlighted outliers
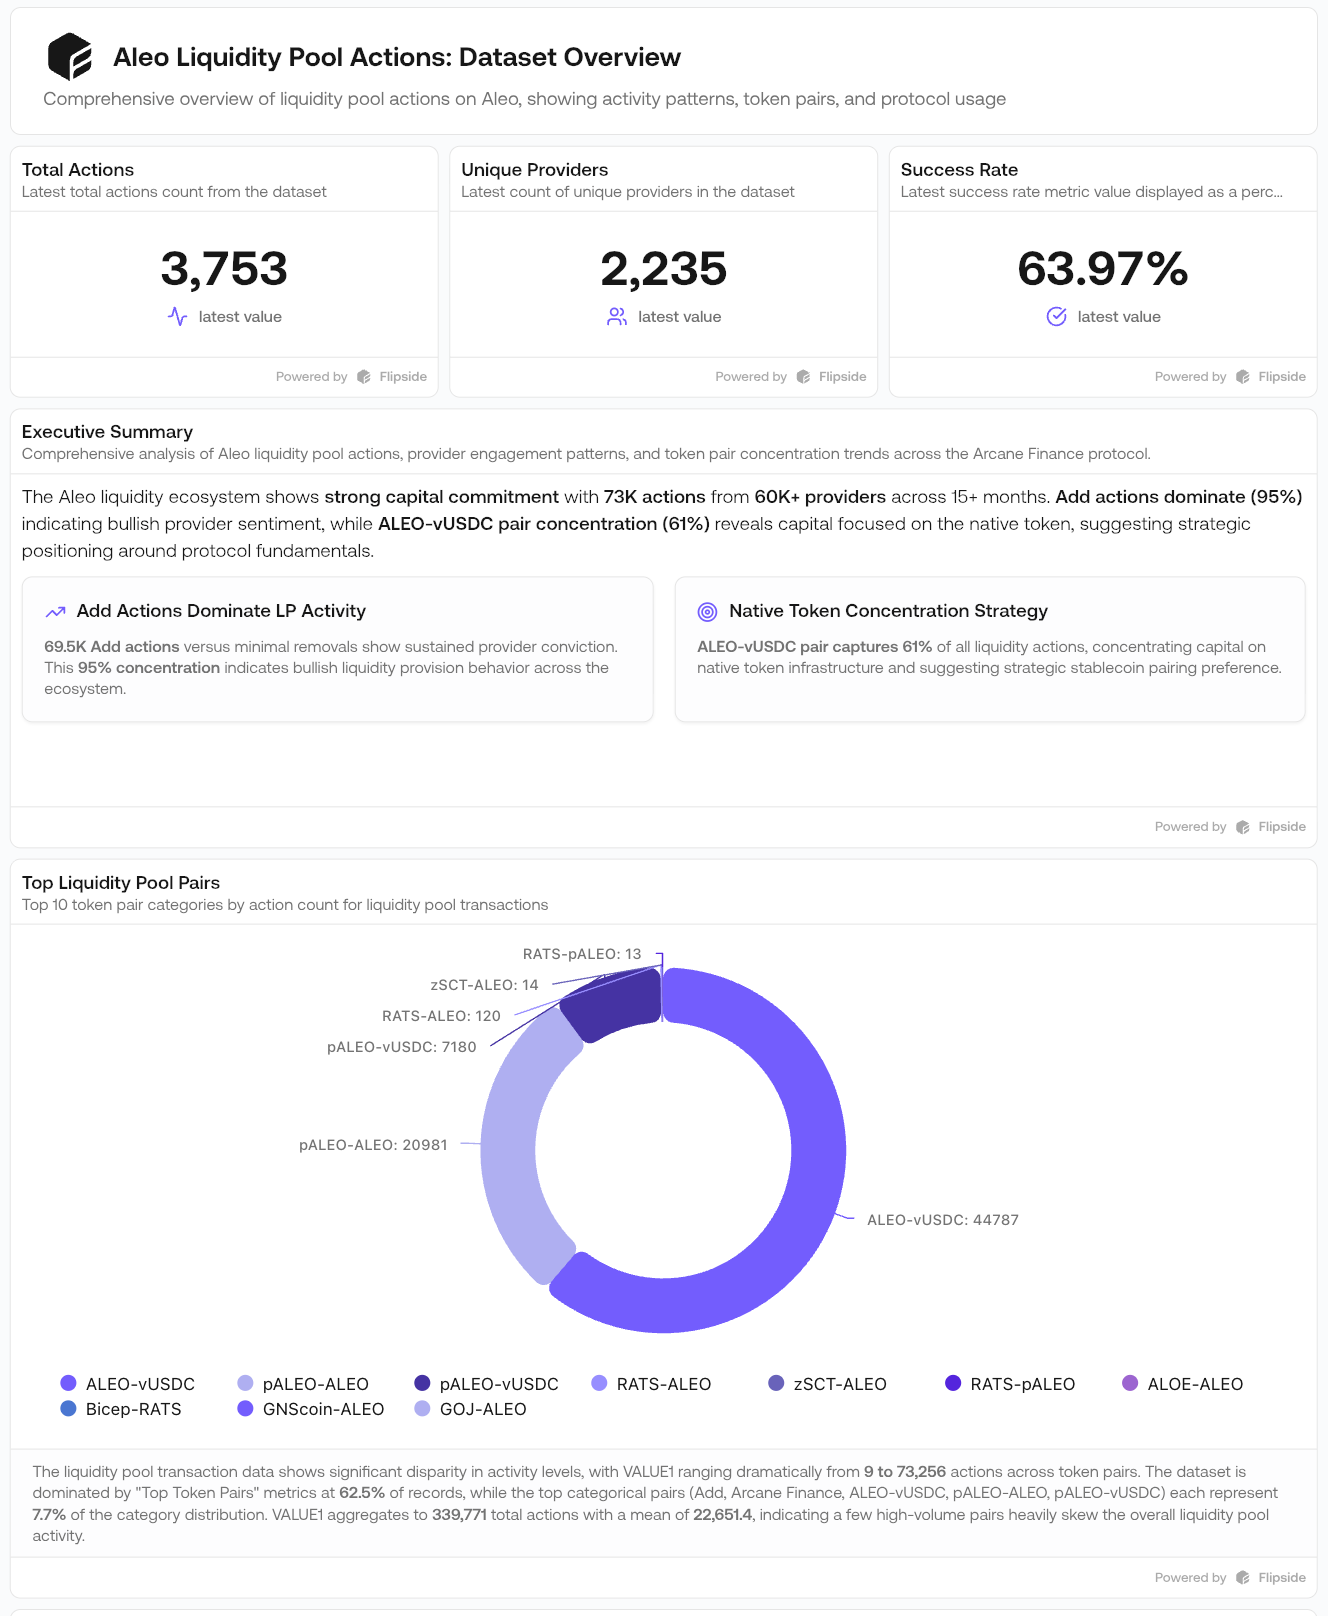
Dashboards
Dashboards
Multi-panel artifacts with:
- Multiple charts
- Key metrics at the top
- Interactive filtering
Comparison Views
Comparison Views
Side-by-side visualizations:
- Protocol A vs Protocol B
- Chain X vs Chain Y
- Time period 1 vs Time period 2
Sharing artifacts
Control who can view your artifacts with three visibility levels.Visibility levels
Personal (Only Me)
Personal (Only Me)
The artifact is private to your account. This is the default setting.
Organization
Organization
The artifact is visible to your entire team and appears on their Artifacts pages.
Public
Public
Generates a public URL accessible to anyone, including external stakeholders. Public artifacts display a professional header with your organization’s avatar and a “Built with Flipside” attribution.
Managing artifacts
Use the toggle on the Artifacts page to filter between:- Artifacts you created
- Artifacts shared with you by your team